
It’s time to launch or grow your SaaS.
What metrics should you be prioritizing? ARR? MRR? CTC? Let’s dive into all of that and more…
I want to get right into it for you so let’s start with these:
Definitions For SaaS Growth
The Basics
- ARR: Stands for Annual Recurring Revenue. This is the sum of all recurring revenue from active subscribers, calculated on a yearly basis.
- MRR: Stands for Monthly Recurring Revenue. This is similar to ARR, but calculated on a monthly basis.
- LTV: Life-Time Value is the projected worth of a customer during their entire relationship with your company. This is calculated by multiplying the average revenue generated per user each month by the average length of time they stay subscribed.
- CAC: Stands for Customer Acquisition Cost. This represents the total cost to acquire a new customer, including sales and marketing expenses. To calculate CAC, divide the total cost by the number of new customers acquired in a given period.
- Churn: Churn rate refers to the percentage of subscribers who cancel their subscription within a given period. This is an important metric to track as it directly impacts your revenue and customer retention.
- T2D3: Not a star in the constellation, but a path to the stars — one that ambitious SaaS startups should religiously follow.
- CAC Ratio: Compares the LTV to CAC to determine how quickly you are recouping your customer acquisition costs. A ratio of 3:1 or higher is generally considered healthy.
- MQLs: Stands for Marketing Qualified Leads. These are leads that have been identified as potential customers based on specific criteria, such as demographics or online behavior.
- Product-Market Fit: That blessed isle at which you must arrive before the real growth can commence.
- LVR: Lead velocity rate assesses how fast the number of Marketing Qualified Leads (MQLs) your pipeline produces is growing.
The Market Phrases
- TAM: Stands for Total Addressable Market. This is the total potential market size for your product or service.
- SAM: Stands for Serviceable Addressable Market. It’s a subset of the TAM and refers to the portion of the market that you can realistically reach and serve with your product or service.
- SOM: Stands for Serviceable Obtainable Market. This is the portion of the SAM that you can realistically target and convert into customers.
The Nuances
- NPS: Stands for Net Promoter Score. This measures customer satisfaction and loyalty by asking one simple question: “How likely are you to recommend our product/service to a friend or colleague?” Customers are then categorized into promoters, passives, and detractors, and a score is calculated based on the percentage of each category.
- ARR/MRR Per Employee: This metric measures the efficiency of your workforce by dividing the ARR or MRR by the number of employees. It can also help determine when it’s time to hire more employees to support growth.
- LVR: Stands for Lead Velocity Rate. It measures how quickly your company is generating new leads and can be a leading indicator of future revenue growth.
- CAC by Channel: This metric tracks the CAC for each customer acquisition channel (i.e. social media, email marketing, paid advertising) to determine which channels are most cost-effective.
- CAC Payback Period: This refers to the amount of time it takes for your company to recoup the cost of acquiring a new customer. Ideally, this should be less than 12 months.
- MRR Churn Rate: This metric measures the percentage of MRR that is lost due to churn. It’s calculated by dividing the total monthly revenue lost from churn by the total MRR at the beginning of the month.
- Net MRR Churn: Takes into account both new and existing customers, and calculates how much recurring revenue was gained or lost in a given period.
What is ARR, and Why Should You Care?
Annual Recurring Revenue (ARR) represents the total revenue generated from subscriptions within a year. When discussing valuation, ARR is a key metric, often favored over Monthly Recurring Revenue (MRR).
So, how is ARR calculated in SaaS?
While a quick Google search can provide various methods, for today’s discussion, the focus is on understanding ARR and its growth rather than the nitty-gritty of accounting.
A crucial aspect is to ensure clarity on the definition and formula used, maintaining consistency across the board. One common formula is:
Number of Paying Users x ARPU = ARR.
It’s worth noting that one-time payments are typically excluded from recurring revenue calculations like ARR. Additionally, recurring payments with short contract terms may be omitted from ARR computations.
Remember the distinction between ‘booked/earned/contracted’ revenue and ‘acquired/received/cash-in-bank’ revenue. Other useful formulas include:
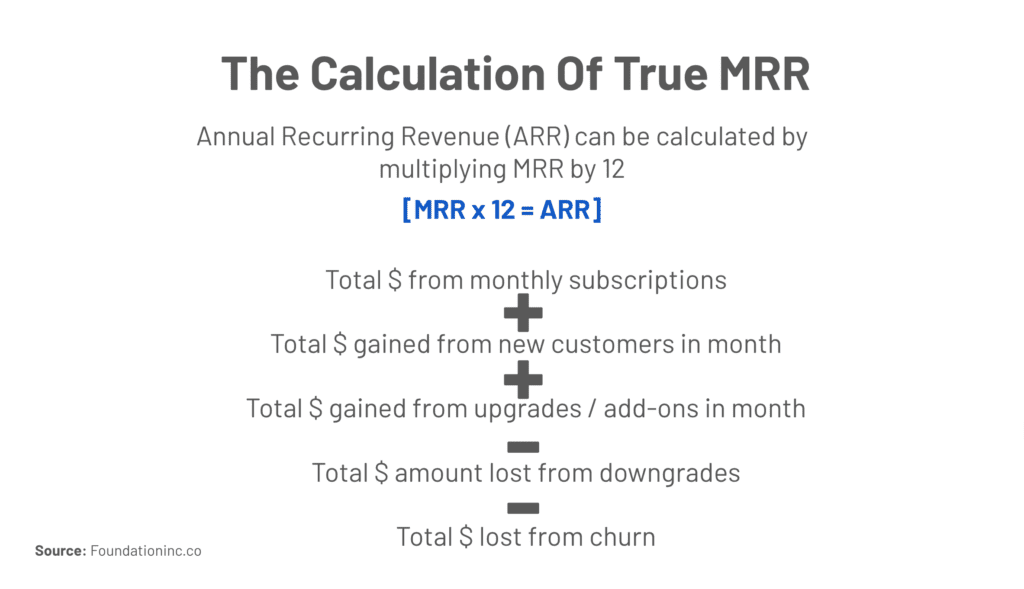
ARR = MRR x 12 and ARR = Yearly subscription revenue + expansion revenue – churn loss.
In essence, when discussing ARR, focus on metrics and strategic decisions.
For accounting specifics, adhere to GAAP revenue guidelines (if in the USA).
Further, discussing ARR allows for creating a conversation around growth trends and gives insight into the health of the business.
Why MRR Matters Too
Monthly Recurring Revenue (MRR) is a crucial metric for SaaS companies as it’s more sensitive to changes than ARR. It provides more frequent (monthly) updates on revenue growth and can highlight any issues with retention or churn in real-time.
Similar to ARR, there are various ways to calculate MRR, but it’s typically based on the subscription amount multiplied by the number of subscribers.
It’s worth noting that changes in subscription price or plan can impact MRR significantly. Therefore, tracking both ARR and MRR is essential for a comprehensive understanding of your revenue growth.
Understanding Monthly Recurring Revenue
MRR is the monthly plot on your ARR map, showing you not just where you are but where you are likely to go. It’s a smaller piece of the puzzle, to be sure, but it has a voice that should not, nay cannot, be ignored.
Calculating MRR
At its simplest, MRR is the sum of all revenue from your SaaS subscriptions for a single month.
But don’t be fooled; there’s significantly more nuance that deserves your attention.
For instance, tracking new MRR vs. churned MRR provides critical insights into the health of your business and can help identify areas for improvement.
Expansion MRR also needs to be considered, churn MRR needs to be pulled out, and one of the most valuable types of MRR — new business MRR — can’t be overstated.
Tools like Baremetrics give founders a glimpse at their key MRR metrics in one place:
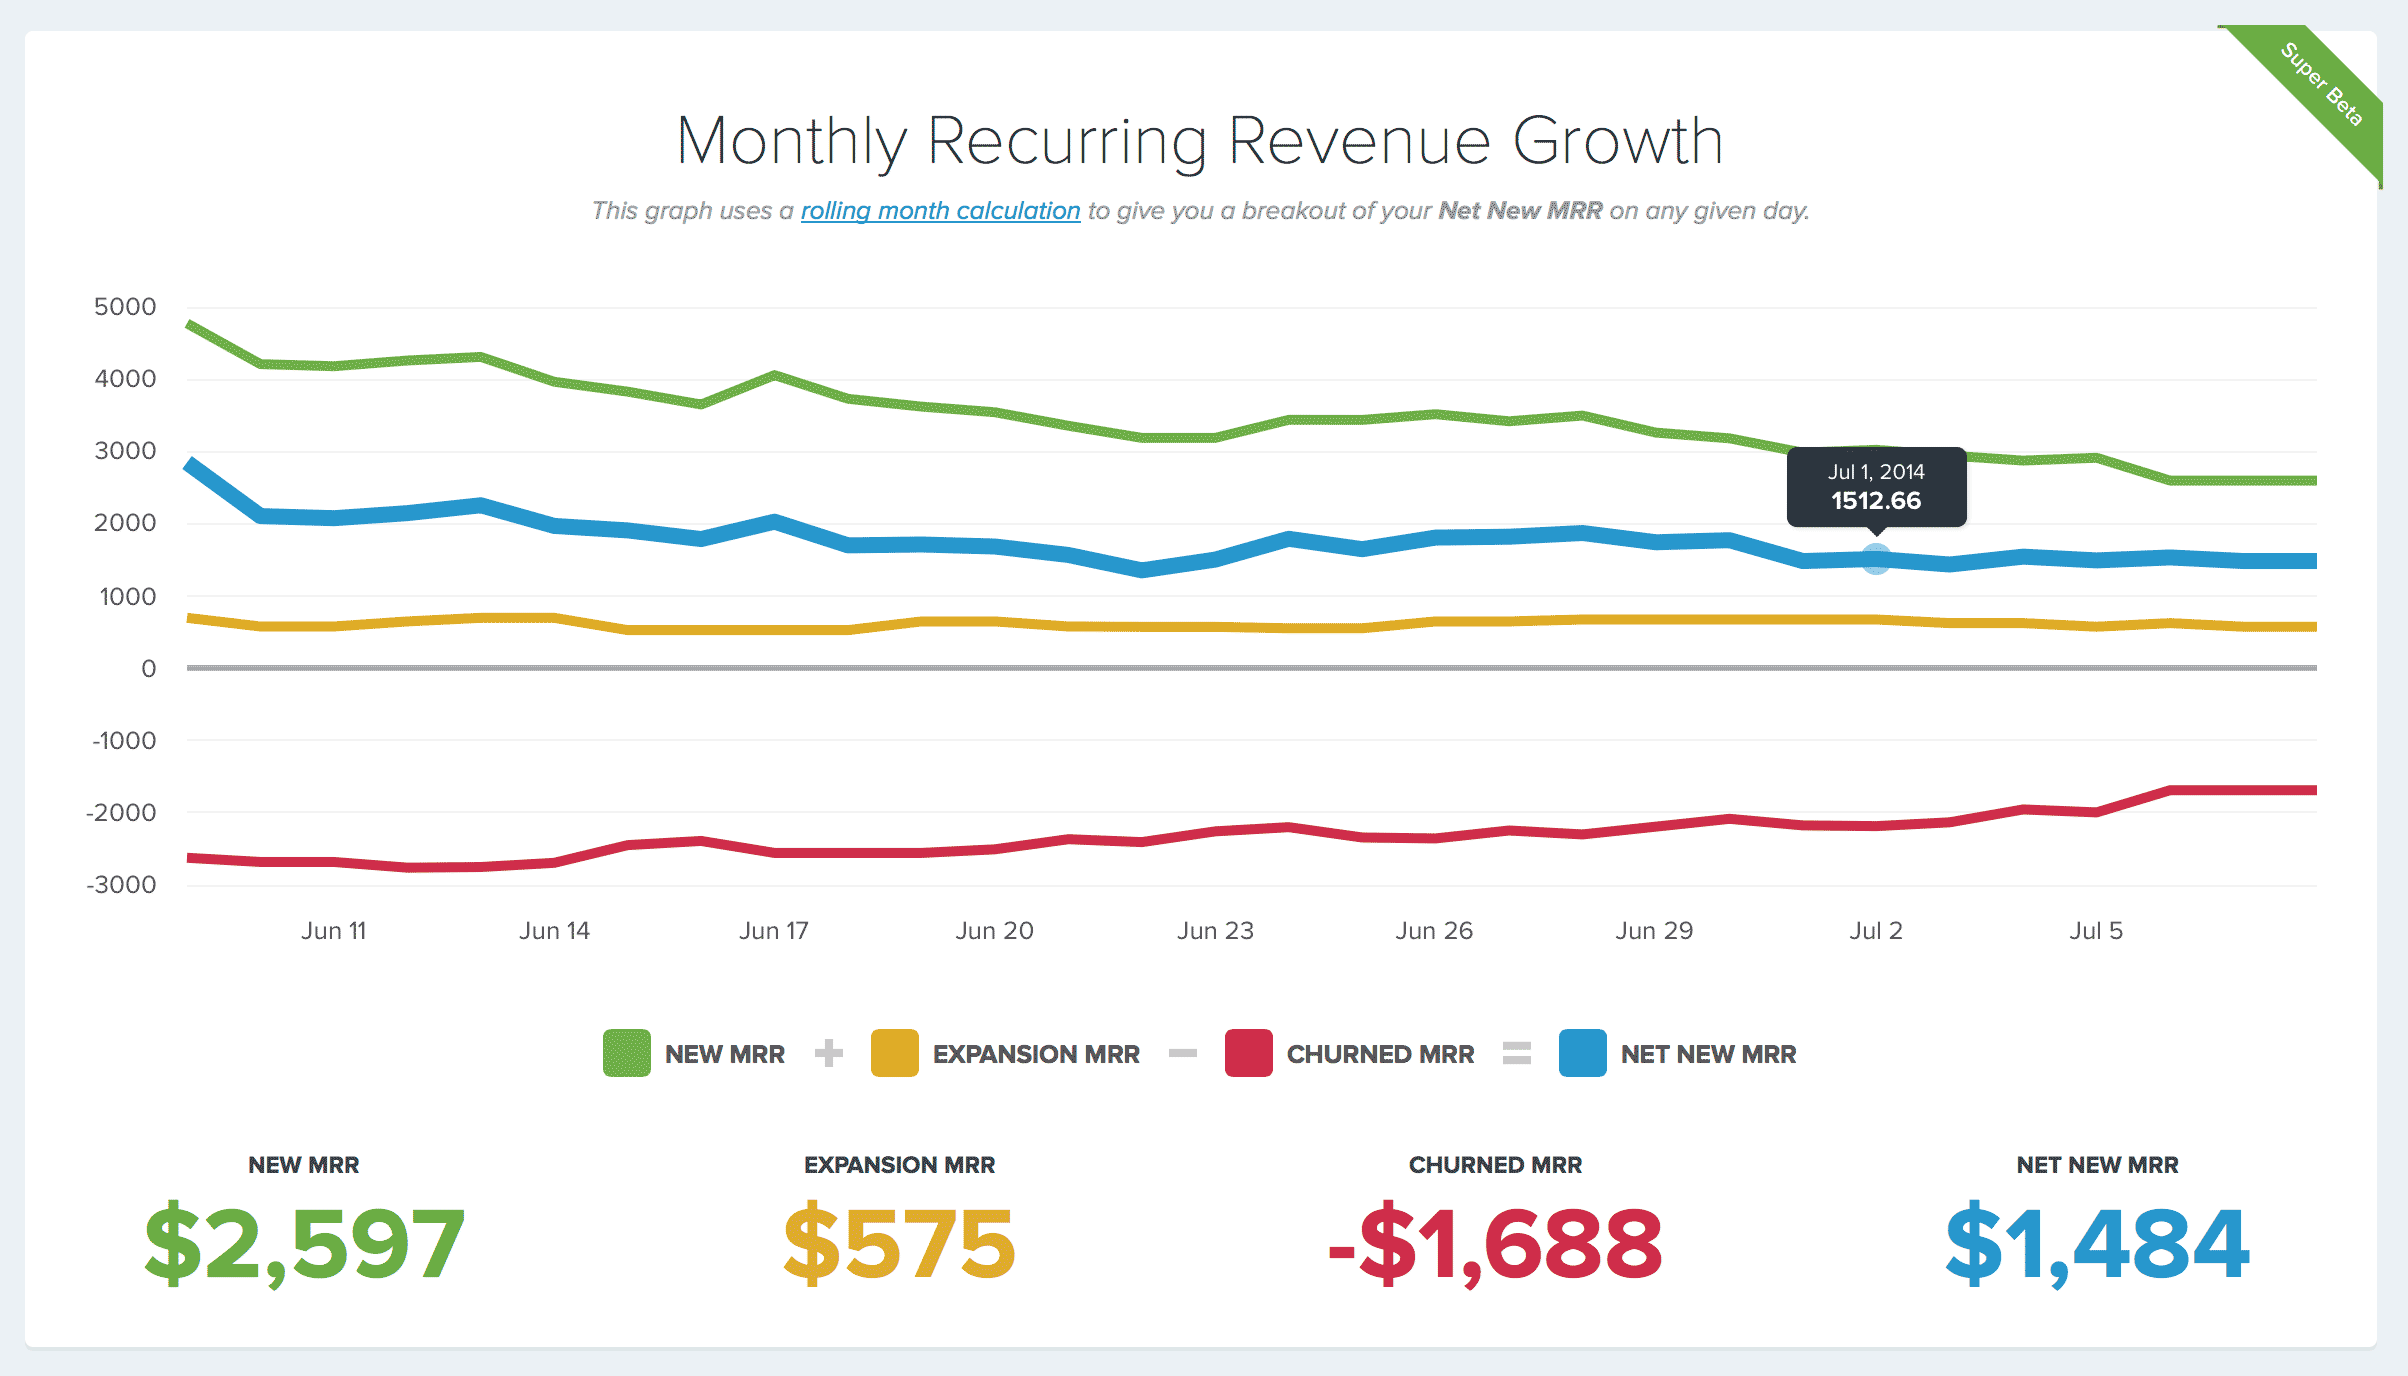
Here’s a quick definition of each part of MRR worth measuring:
New MRR is the increase in MRR from new subscribers who signed up within the month.
Lost MRR is the decrease in MRR from cancellations or downgrades within the month.
Expansion MRR measures revenue growth from existing customers upgrading their plans, purchasing add-ons, or expanding usage.
Churned MRR is the revenue lost from customers canceling subscriptions or reducing their usage.
Net New MRR is the sum of all new, expansion, and reactivation MRR minus churned MRR. This is a critical metric for understanding your overall revenue growth rate.
So what can we take away from all this talk about ARR and MRR?
Firstly, both metrics are crucial for understanding the health and growth of your SaaS business.
But again..
These aren’t the only factors that matter.
Churn and CAC: The Silent Undercurrents
Churn represents the percentage of accounts that opt out or do not renew subscriptions.
A high churn rate can harm Monthly Recurring Revenue (MRR) and signal dissatisfaction with a product or service.
How Is Churn Calculated?
To calculate churn, you need to know the number of customers lost during a given period and divide that by the total number of customers at the beginning of that period.
For example, if your company had 500 customers on January 1st and only 450 on January 31st, your churn rate for that month would be (50/500) or 10%.
This metric can be broken down further into gross churn and net churn.
Gross churn is the total number of customers that leave during a given period, while net churn takes into account any expansion revenue from existing customers.
But it’s not just about tracking churn; understanding Customer Acquisition Cost (CAC) is equally important for sustainable growth.
How Is CAC (Customer Acquisition Cost) Calculated?
CAC is calculated by dividing the total cost of acquiring customers (sales and marketing expenses) by the number of new customers acquired during a specific period.
For example, if your company spent $10,000 on sales and marketing in one month and acquired 100 new customers, your CAC would be $100 per customer.
It’s worth noting that CAC can vary depending on the channel used for customer acquisition, making it essential to track and optimize CAC by channel.
Measures the cost of acquiring a new customer and is calculated by dividing the total cost of sales and marketing by the number of new customers acquired in a given period.
CAC can be further broken down by channel to determine which channels are most effective and where you should allocate your budget.
A high CAC ratio (the LTV to CAC ratio) could indicate that it’s time to rethink your pricing or marketing strategies.
Strategically Deciding How To Measure Churn
The timing and method of counting and calculating can significantly influence the mathematical outcomes and eventual churn rate.
For instance, consider a scenario where a product started March with 8,000 customers, gained 2,000 new customers during that month, and had 1,000 customers who chose to leave. Should these departing customers be divided by 10,000 (total customers at the end of the month), 9,000 (total customers at the beginning of the month, accounting for the addition of 2,000 and the subtraction of 1,000), or 8,000 (total customers at the start of the month, irrespective of additions)? This decision could alter the monthly churn rate from 10% to 11.1% or 12.5%.
Furthermore, there is the aspect of determining the “moment of churn” – should churn be calculated based on when users cancel or when their subscription officially ends (which might be later in the month or even at the end of the year)? Opting for the latter approach could eliminate the possibility of a customer churning in the same month they sign up, potentially masking cases where customers are dissatisfied enough to cancel almost immediately.
Nevertheless, numerous companies have embraced more refined and nuanced methodologies for churn calculation. Some opt for an average of the customer count at the start and end of the specified period as the denominator in the churn formula. Others utilize weighted averages or rolling metrics in an attempt to derive more precise churn rates.
Utilizing other strategies could involve segmenting the total customer base into distinct cohorts and computing individual churn rates for each. This detailed approach helps pinpoint which customer segments exhibit higher churn rates and distinguishes between new and long-standing customers.
Regardless of the chosen calculation method, consistency in applying the same formula is paramount for accurate period-to-period comparisons and establishing dependable KPIs. While fluctuations may occur due to a surge in new customers, this approach offers a reliability.
The Causes For Churn
While there’s no single solution to this issue, several common reasons contribute to customer churn:
- Loss of product value: When the initial appeal or usefulness of the product diminishes due to changing priorities or product alterations.
- Diminished motivating factors: Customers stop using a product when it no longer solves their problems or meets their needs, which can change over time.
- User experience frustrations: Issues like poor usability, feature gaps, or consistent bugs and performance problems can drive customers away.
- Missing essential product capabilities: If a customer requires a specific feature that the product lacks, it might lead to dissatisfaction.
- Insufficient value for the cost: When the return on investment for the customer no longer justifies the expense.
- Switching to an alternative solution: Customers may opt for a competitor or a free/existing alternative for their needs.
- Damage to product reputation: Issues like PR nightmares, CEO issues, cybersecurity concerns, performance glitches, poor customer service, or misconduct can tarnish a product’s image.
Each departing customer has unique reasons for discontinuing usage. From my experience, conducting exit surveys, interviews, and analyzing churned customers’ behavior can give you a great glimpse into the factors that caused churn.
Keeping CAC in Your Crosshairs
Battling the CAC beast starts with a scalpel, not a broadsword.
Analyzing the CAC across marketing channels, honing in on the most cost-effective means of acquisition, and constantly reevaluating the figures will keep you from being flanked by unseen costs. A few tools that can help with this are ChurnBuster, Profitwell, Paddle and Chargebee.
What is the rule of 40?
A SaaS company should have a combined growth rate and profit margin of over 40% in order to be considered successful. This is known as the rule of 40.
The rule of 40 is often used as a benchmark for evaluating the health and potential success of a SaaS company. It takes into account both top-line growth (revenue) and bottom-line profitability, giving a more comprehensive view of the company’s performance.
For example, if a company has a revenue growth rate of 30%, their profit margin should be at least 10% to meet the rule of 40. If a company has a profit margin of 20%, their revenue growth rate should be at least 20%.
If a SaaS company fails to meet the rule of 40, it may indicate that they are sacrificing profitability for unsustainable growth or focusing too much on generating profits while neglecting potential growth opportunities. Striking a balance between growth and profitability is essential for long-term success in the SaaS industry.
However, it’s worth noting that the rule of 40 is not an absolute measure of success and should be used in conjunction with other metrics to evaluate a company’s performance. Factors such as market conditions, competition, and industry trends can also impact a company’s growth and profitability. Continuously tracking and analyzing various metrics, including ARR, MRR, churn rate, CAC, and the rule of 40, can help SaaS companies make informed decisions and drive sustainable growth. So while the rule of 40 is a useful benchmark to keep in mind, it should not be the sole focus when evaluating a company’s success. Remember to take a holistic approach and consider various factors to gain a complete understanding of a SaaS company’s performance.
Navigating Rough Seas to Scale
You’ve reached PMF. Your sails are taut with validation. It’s time to scale.
But how you scale is more important than how fast.
Marketing in the Age of Sails
Traditional marketing channels are gathering dust in a world that moves like a torrent. Your marketing strategies need to be as agile as will-o’-the-wisps; one that lures the seafarers of the digital age to the lighthouse of your SaaS.
- Which are the right signals to send?
- How do you chart your marketing strategy through the fog that cloaks ROI?
Here are a few key marketing metrics every SaaS should know:
- Marketing Originated Customer Percentage – This metric shows the percentage of new customers that were acquired through marketing efforts. It helps you understand how effective your marketing strategies are at bringing in new business.
- Marketing Influenced Customer Percentage – Similar to the previous metric, this one measures the percentage of customers who interacted with a marketing touchpoint during their buying journey before converting.
- Customer Payback Period – This metric measures the amount of time it takes for a new customer to generate enough profit to recoup their acquisition cost. A shorter payback period indicates more efficient and cost-effective marketing strategies.
- Viral Coefficient – This metric calculates how many new users are acquired from each existing user, giving insight into the virality of your product and marketing strategies
- Website Conversion Rate – The percentage of website visitors who take a desired action, such as signing up for a free trial or filling out a contact form. A higher conversion rate indicates an effective website and marketing content.
- Net Promoter Score (NPS) – This metric measures customer satisfaction and loyalty by asking customers how likely they are to recommend your product or service. It can be a good indicator of the success of your overall marketing and customer experience efforts.
- Cost per Lead (CPL) – Measures the cost of generating one lead through marketing efforts. A lower CPL indicates more efficient use of resources and better targeting strategies.
- Customer Lifetime Value (CLTV) – This metric estimates the total amount of revenue a customer is expected to generate over their entire lifetime as a customer, providing insight into the value and potential profitability of your customers.
- Marketing Qualified Leads (MQLs) to Sales Qualified Leads (SQLs) Conversion Rate – This measures the percentage of MQLs that are converted to SQLs, indicating the effectiveness of your marketing and sales alignment.
- SEO Sourced Leads – This metric tracks the number of leads that came from organic search results, giving insight into the effectiveness of your SEO strategies.
As you can see, there are numerous metrics to consider when tracking and evaluating a SaaS company’s performance. These metrics provide valuable insights into various aspects of the business, from customer acquisition to marketing effectiveness to overall profitability. By
Keeping track of these metrics can help you understand the impact and ROI of your marketing efforts and make informed decisions around marketing.
Setting the Right Price
Your pricing strategy is your compass in the SaaS world. It’s not a number you just slap on a product; it’s a carefully plotted map of perceived value, competitive analysis, and growth potential.
- How do you set a price that’s fair yet profitable?
- What’s the magic number that keeps customers and accountants happy?
If you’re not sure your price is right check out this Ultimate Guide To SaaS pricing.
The Growth Levers For Marketers To Pull
Creating your marketing strategy is to create the legend of your product. As the founder of one of the Top Content Marketing Agencies in Canada / USA that serve SaaS brands – I know first hand how important it is to pull the right growth levers for a SaaS company.
Each story told, each myth unraveled, and each tale of value shared is part of the treasure map that leads to increased MRR and expanded ARR.
Growth & Distribution Channels
The metrics that you prioritize are going to closely connect back to the channels you focus on.
Every SaaS brand should strive to see their growth metrics from an SEO lens look like this:
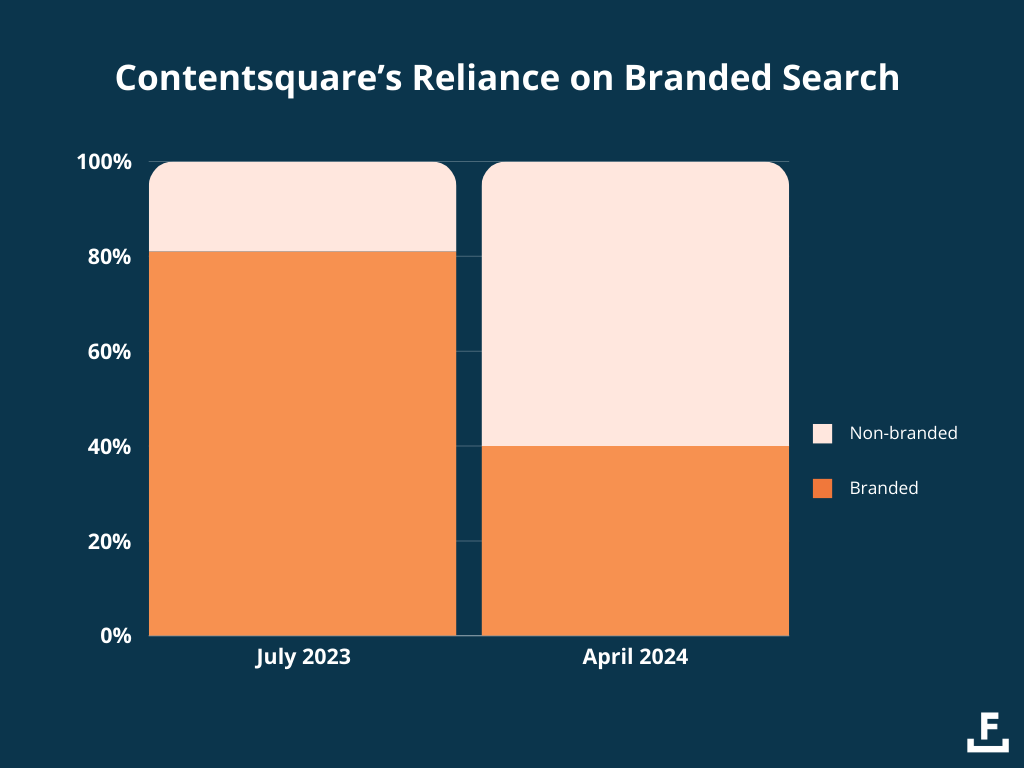
What exactly are you looking at in that image?
It’s a shift for a brand that was generating most of it’s traffic from branded search terms to a brand that is generating traffic from non-branded search terms.
This is the ideal situation for any SaaS looking to drive growth.
Ensure that you’re prioritizing growth & distribution channels that translate into MRR & ARR by keeping a finger on the pulse of all the things we talked about in this piece.
Bookmark it.
This is the ultimate guide to understanding MRR & ARR from a marketers lens.
Growth metrics like the various datapoints outlined above are important for SaaS because SaaS businesses are completely reliant on subscriptions and customers.
Knowing the growth trajectory is important to sustain your business in the long run.
I hope you found this valuable and can use it for driving your own growth initiatives.